


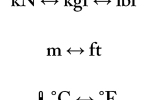
Members: Pulley Efficiency
Pulley efficiency seems initially like a simple thing to measure, however it presents an excellent opportunity to consider various aspects of experiment design.
Experiment design
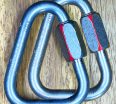
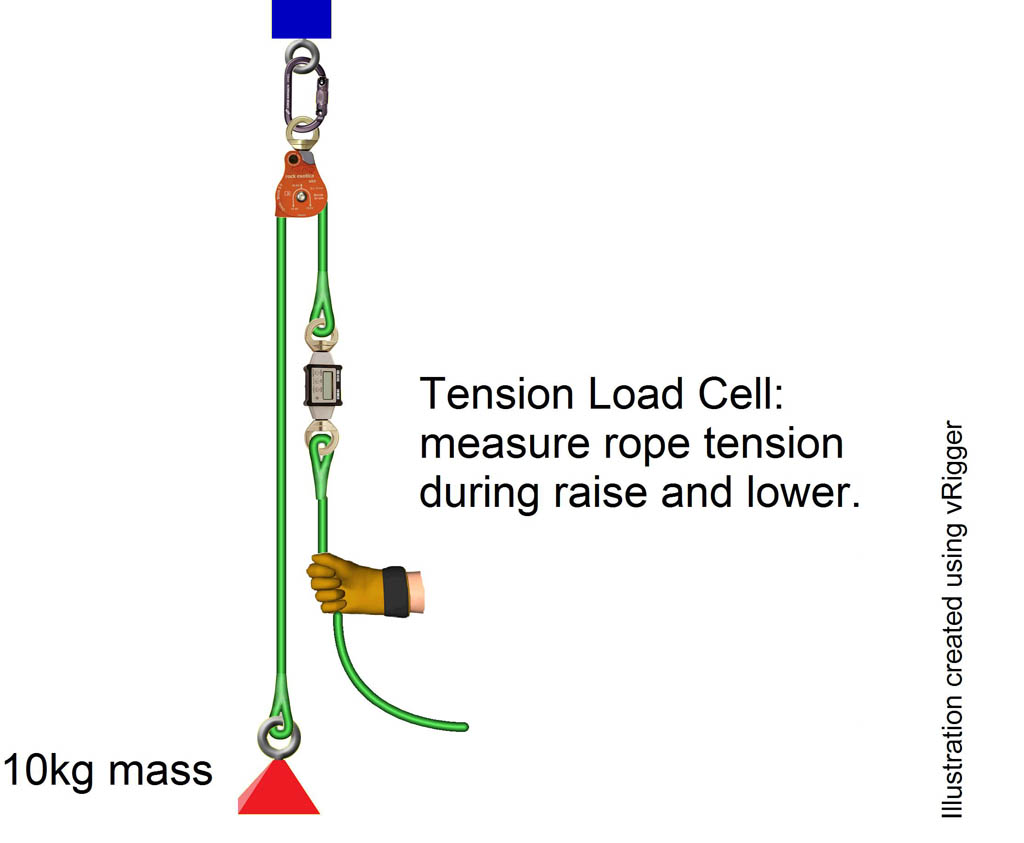
At face value it would seem that we could simply set up an overhead pulley and place a known mass on one side and a load cell on the other and compare the difference during raise and lower.
There are several problems with this approach:
- While the mass may be known, what happens as the load moves up and some of the mass of the rope moves from one side of the pulley to the other?
- Is the mass sufficiently large so that the resolution of the tension load cell is not significant?
- Will the pulley efficiency differ for light and heavy loads?
- Can the tension be applied smoothly so that acceleration and deceleration spikes are not misleading?
- Is the change in direction of the rope a consistent and meaningful value (ie 180 degrees)?
Pulley efficiencies are often included in calculations by simply multiplying the tension on the input side by an efficiency value (E) to determine the output tension. For example, a pulley with 90% efficiency (or 10% loss) would give:
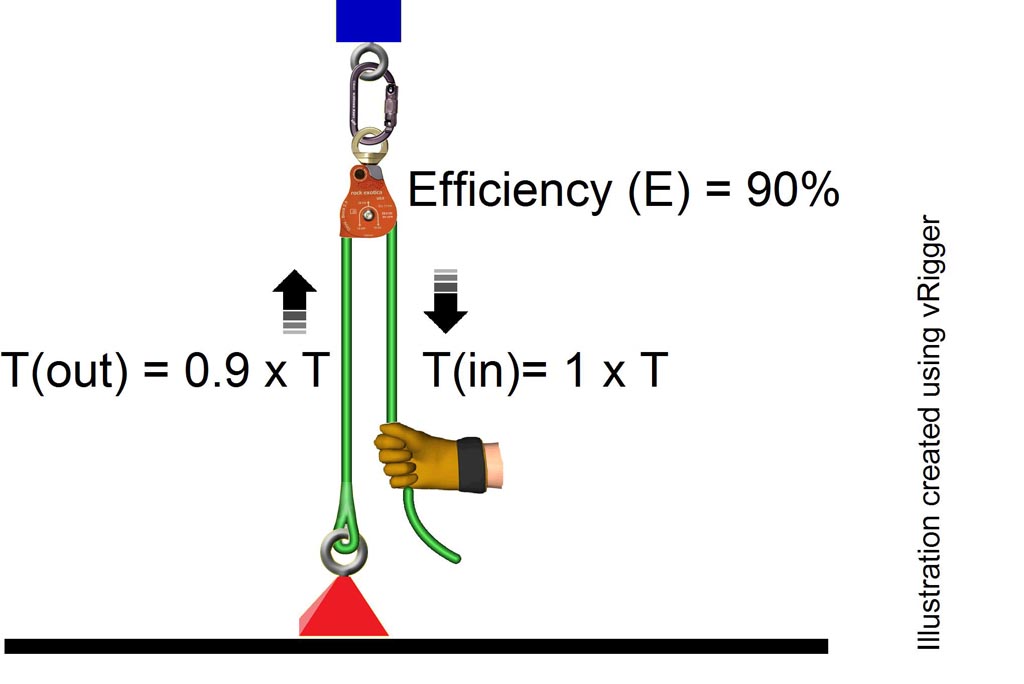
If the mas is suspended by the rope then the tension in the strand attached to the mass will be equal to the weight (W) of the mass. The relationships between the weight (W) and input tension required to raise the mass (Traise) and to lower the mass (Tlower) can then be expressed as:
W = T_raise x E
and
T_lower = W x E
These two equations can be combined to eliminate W as:
T_lower = T_raise x E²
or
E = √(T_lower ÷ T_raise)
This now provides a way to derive E by simply measuring the tension required to lower and raise a mass without having to weigh the mass.
Even though we have eliminated the need to weigh the mass and monitor the tension in the output strand of the pulley we still need to choose an appropriate load. A 100kg test mass was chosen for the experiment for the following reasons:
- This is typical of the loads managed in rope based systems.
- 100kg is significantly heavy that we should not have to be overly concerned with the mass of the rope and connectors.
- This should result in sufficient tension to overcome any resolution limitations with the load cell.
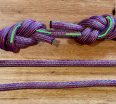
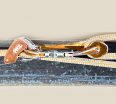
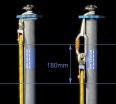
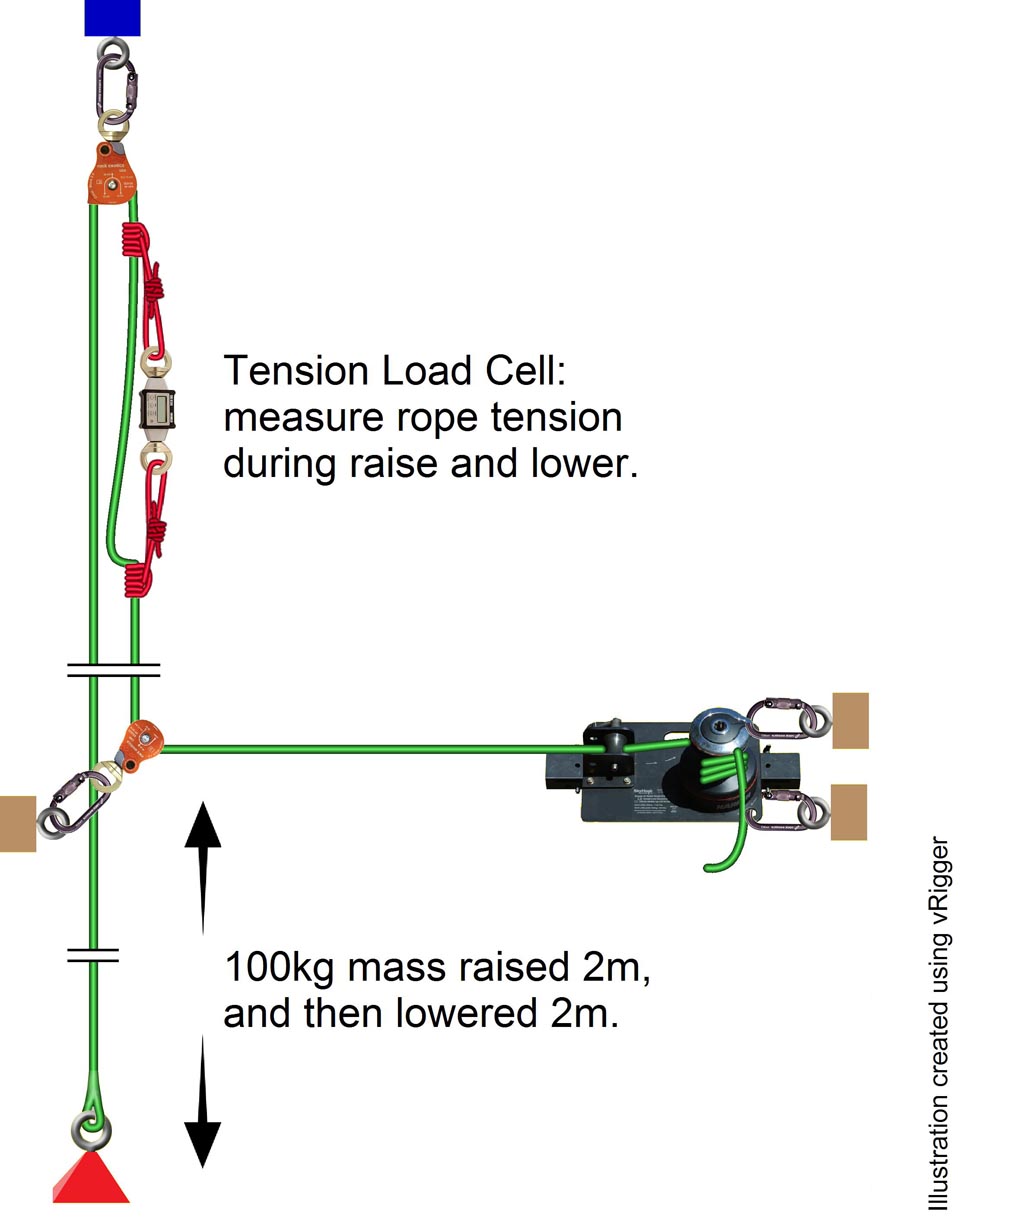
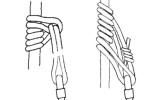
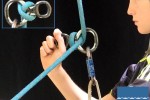
Another issue needing resolution is the consistency of the complete 180 degree direction change for the rope as it passes through the pulley. If the simple setup shown in the first image is used then the finite width of the test mass will push laterally on the tensioned rope and push the angle wider and wider as the mass is raised. This, and the need for controlled pull and lower rates, resulted in the following setup:
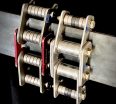
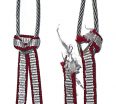
Samples for testing
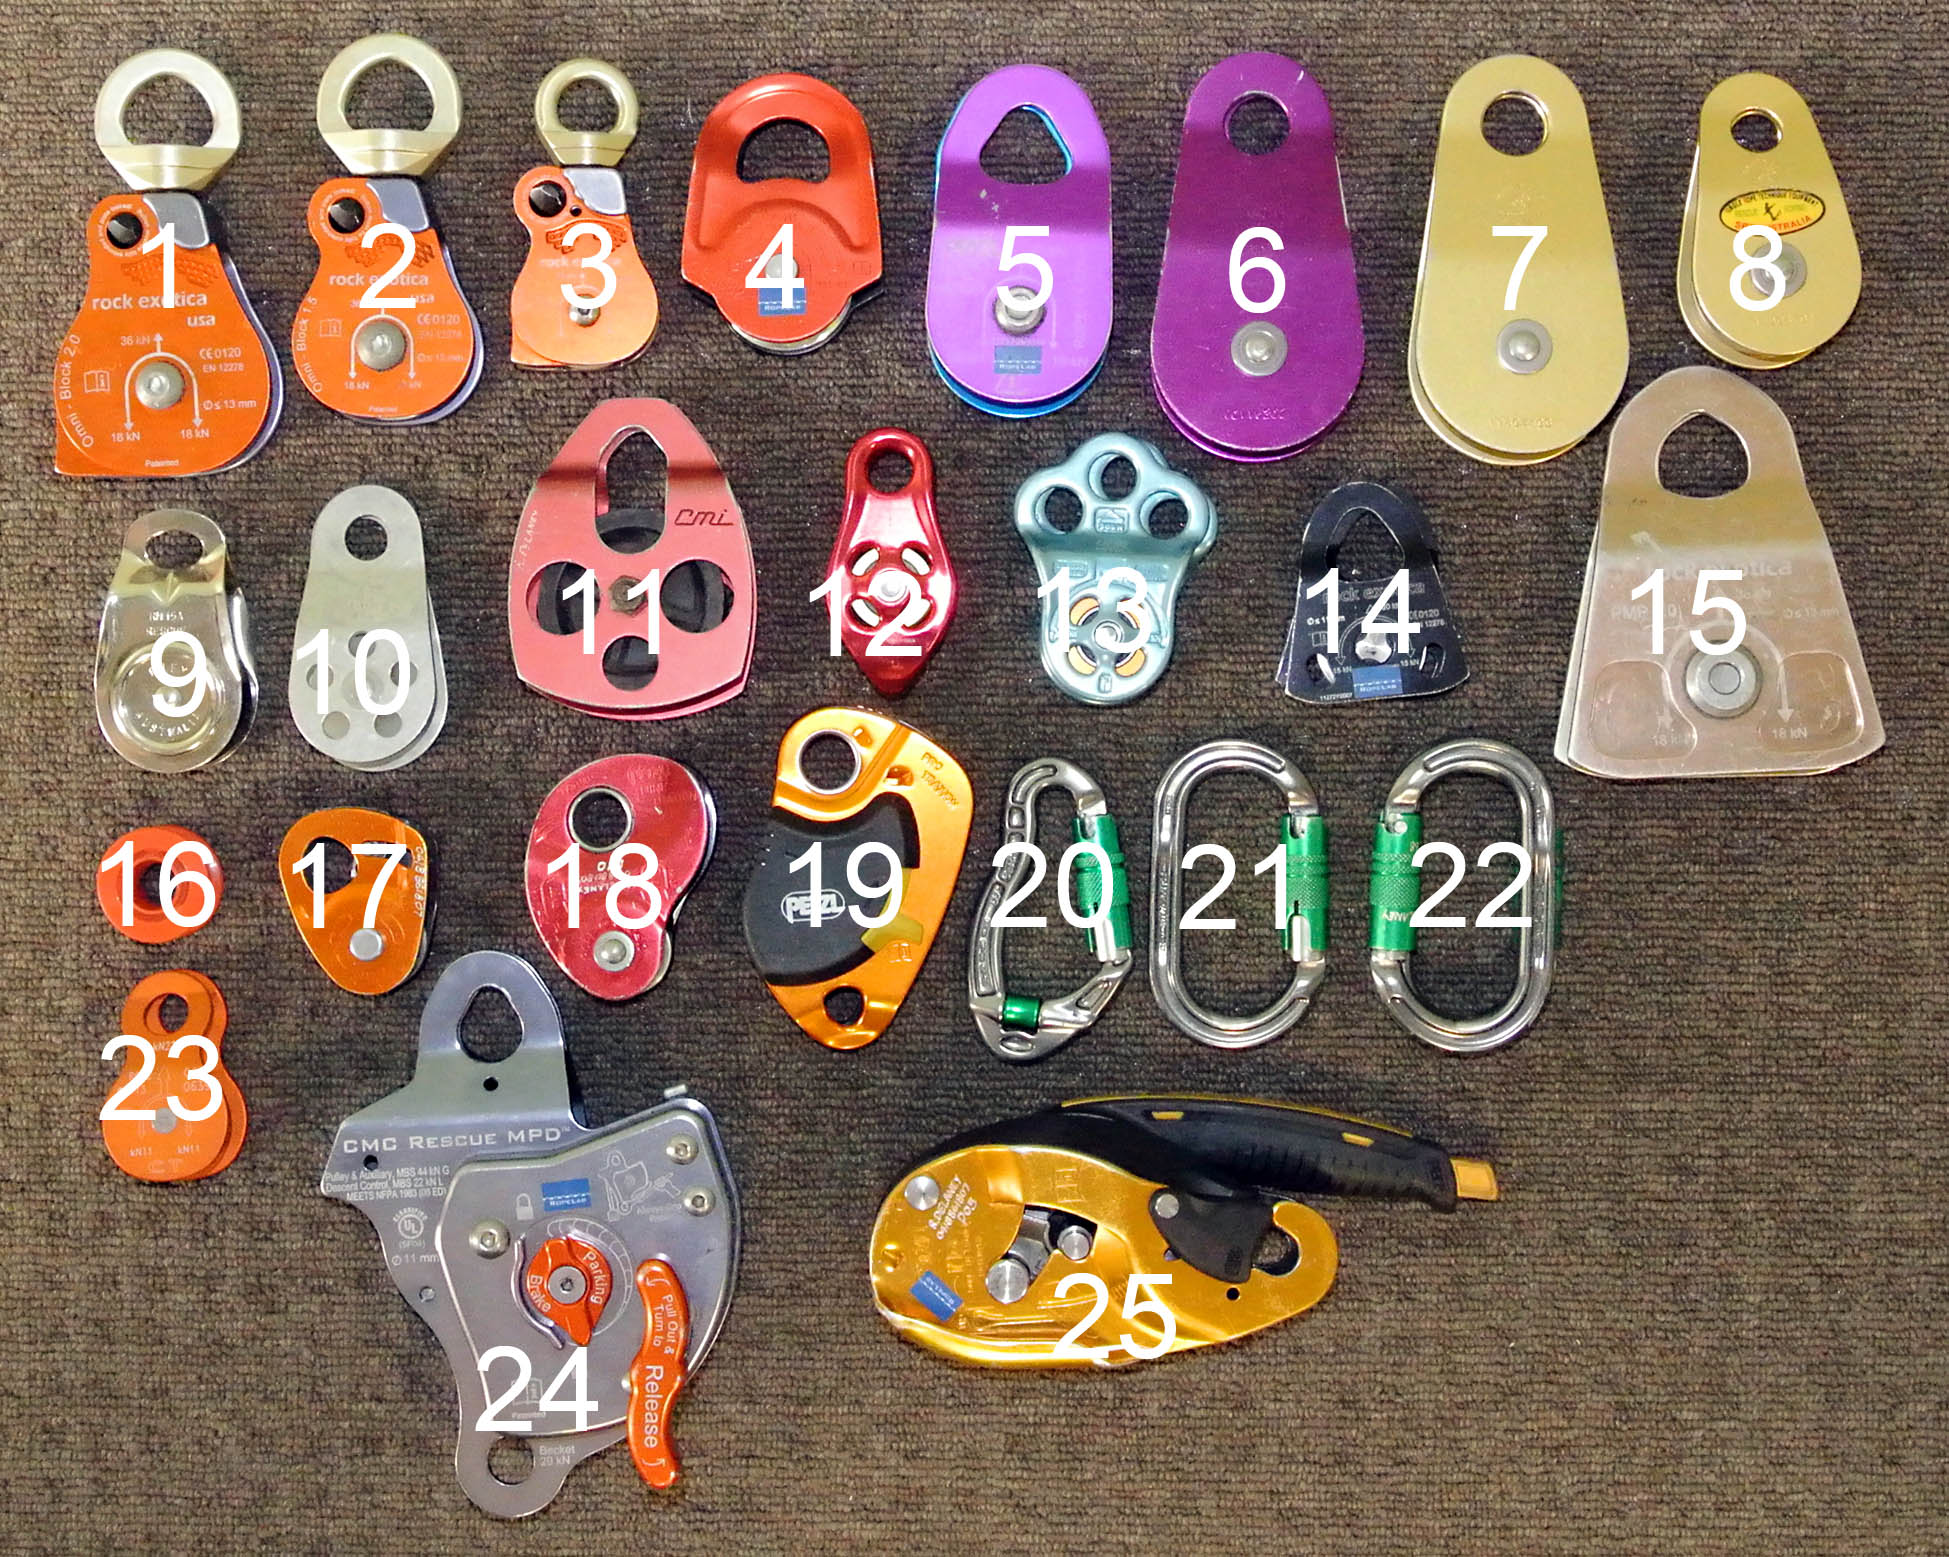
A wide range of pulleys was selected but it should be noted that they were of varying age and condition. Given the fact that many people set up hauling systems without pulleys a few single and double carabiner options were also tested. Lastly, given the inclusion of auto-locking progress capture devices in technical rescue work, the Petzl ID and CMC Rescue MPD were also included but, obviously, only in the free-running direction.
| # | Brand | Model | Condition |
| 1 | Rock Exotica | Omni 2.0 | Excellent |
| 2 | Rock Exotica | Omni 1.5 | Excellent |
| 3 | Rock Exotica | Omni 1.1 | Good |
| 4 | Petzl | Rescue | Excellent |
| 5 | Petzl | P50 | Good |
| 6 | SRT | P3aBB | Good |
| 7 | SRT | P3a | Fair |
| 8 | SRT | P2a | Fair |
| 9 | Riley | RM15A | Excellent |
| 10 | Chouinard | BD nylon | Fair |
| 11 | CMI | 2 3/8″ red/black | Fair |
| 12 | DMM | Pinto (bushed) | Excellent |
| 13 | DMM | Triple attachment rapide | Excellent |
| 14 | Rock Exotica | Mini single 1.1 | Good |
| 15 | Rock Exotica | PMP 2.0 | Excellent |
| 16 | Petzl | Ultralegere | Fair |
| 17 | Petzl | Micro-traxion | Good |
| 18 | Petzl | Mini-trax | Fair |
| 19 | Petzl | Pro-traxion | Excellent |
| 20 | DMM | Revolver carabiner | Excellent |
| 21 | DMM | Single x UltraO carabiner | Excellent |
| 22 | DMM | Double x UltraO carabiners | Excellent |
| 23 | CT | Orbiter M | Excellent |
| 24 | CMC Rescue | MPD | Excellent |
| 25 | Petzl | IDs | Good |
Method
All devices were tested in a single run of tests with identical equipment. The test mass was built using steel weight plates stacked and fixed as a single 100kg (+/-0.1kg) mass. This mass was then tied directly to the end of a low stretch 11mm rope (Sterling HTP). This rope then ran up through the pulley and through to a Skyhook Rescue Systems capstan winch.
For raising, the winch was driven with a high-torque 28V Milwaukee right-angle drill. To lower the mass, the drill and two of the four wraps around the capstan were removed and the tail of the rope was fed through the remaining two capstan wraps by hand.
Tension in the system was monitored with a 5t wireless tension load cell sampling at 2,000 samples per second. The software on the receiving PC then down-sampled the incoming data stream to 5 samples/second and stored the results in a .csv file for later analysis. Once the system was set up with the tension load cell hanging in-line, a reference zero point was set and this was not changed throughout the tests.
The tests were conducted on a 5.5m high tower. For each test the free hanging test mass was raised and lowered approximately 2m.
Procedure:
- Set up test pulley overhead and reset monitoring software.
- Apply tension gradually using drill powered winch until load leaves ground and is suspended.
- Pause raise and allow system to settle.
- Resume lifting gradually and lift to half height.
- Pause raise.
- Resume lifting suddenly with drill trigger fully depressed.
- Stop raise suddenly at full height.
- Remove drill from winch and unwrap two of the four turns around the winch capstan.
- Gradually release hand-held tension on brake rope to allow the remaining two capstan turns to slide and lower the load.
- Pause lower.
- Resume gradual lower but increase rate during descent.
- Continue lower until load is at rest on the ground.
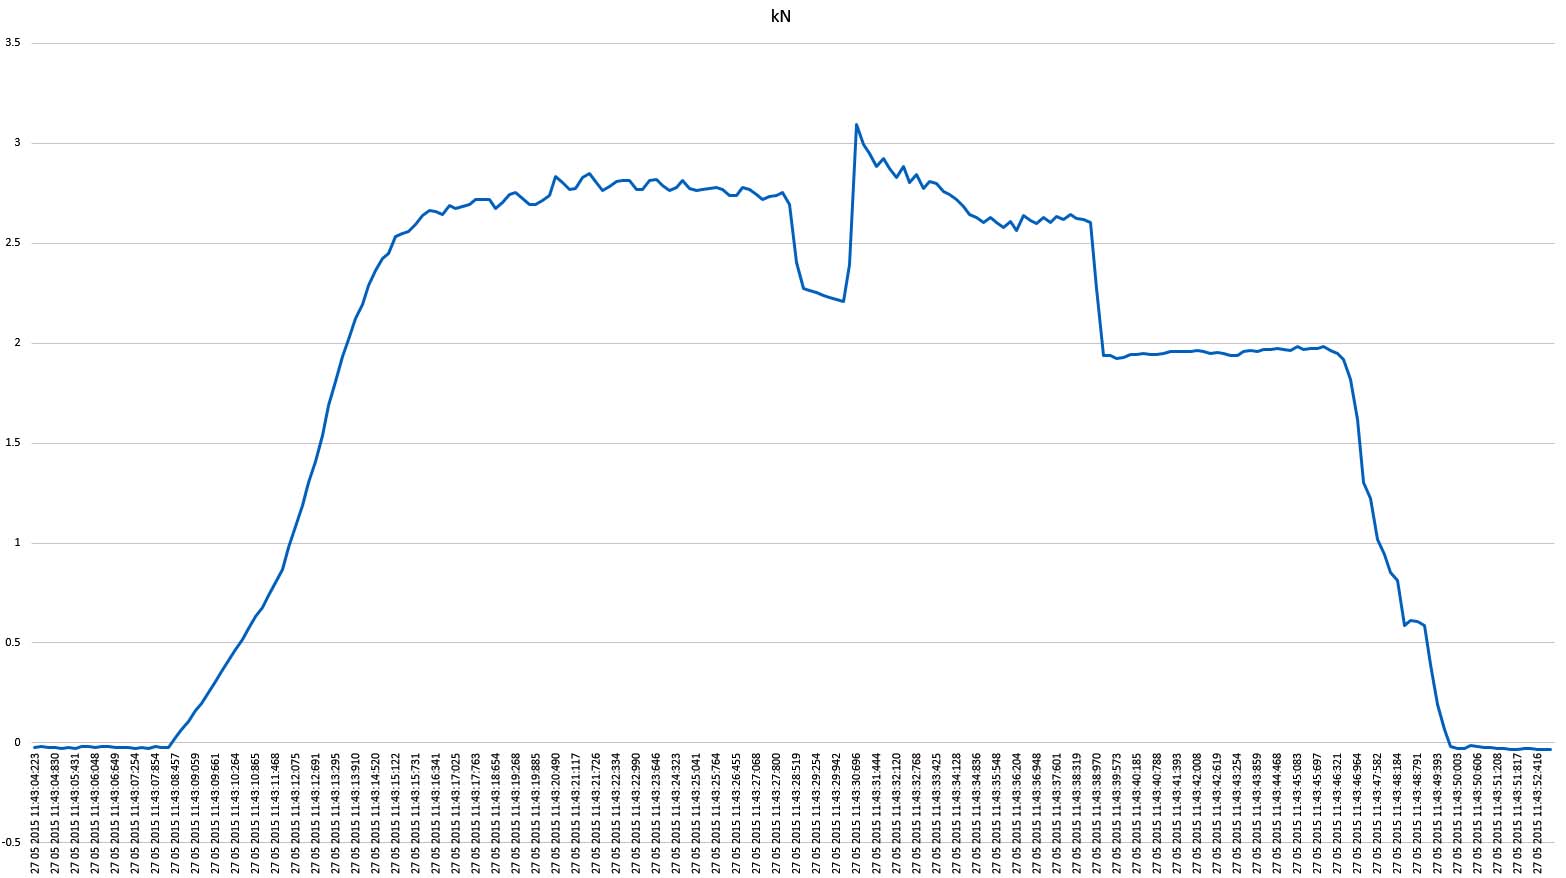
This plot of Tension vs Time shows each of these steps:
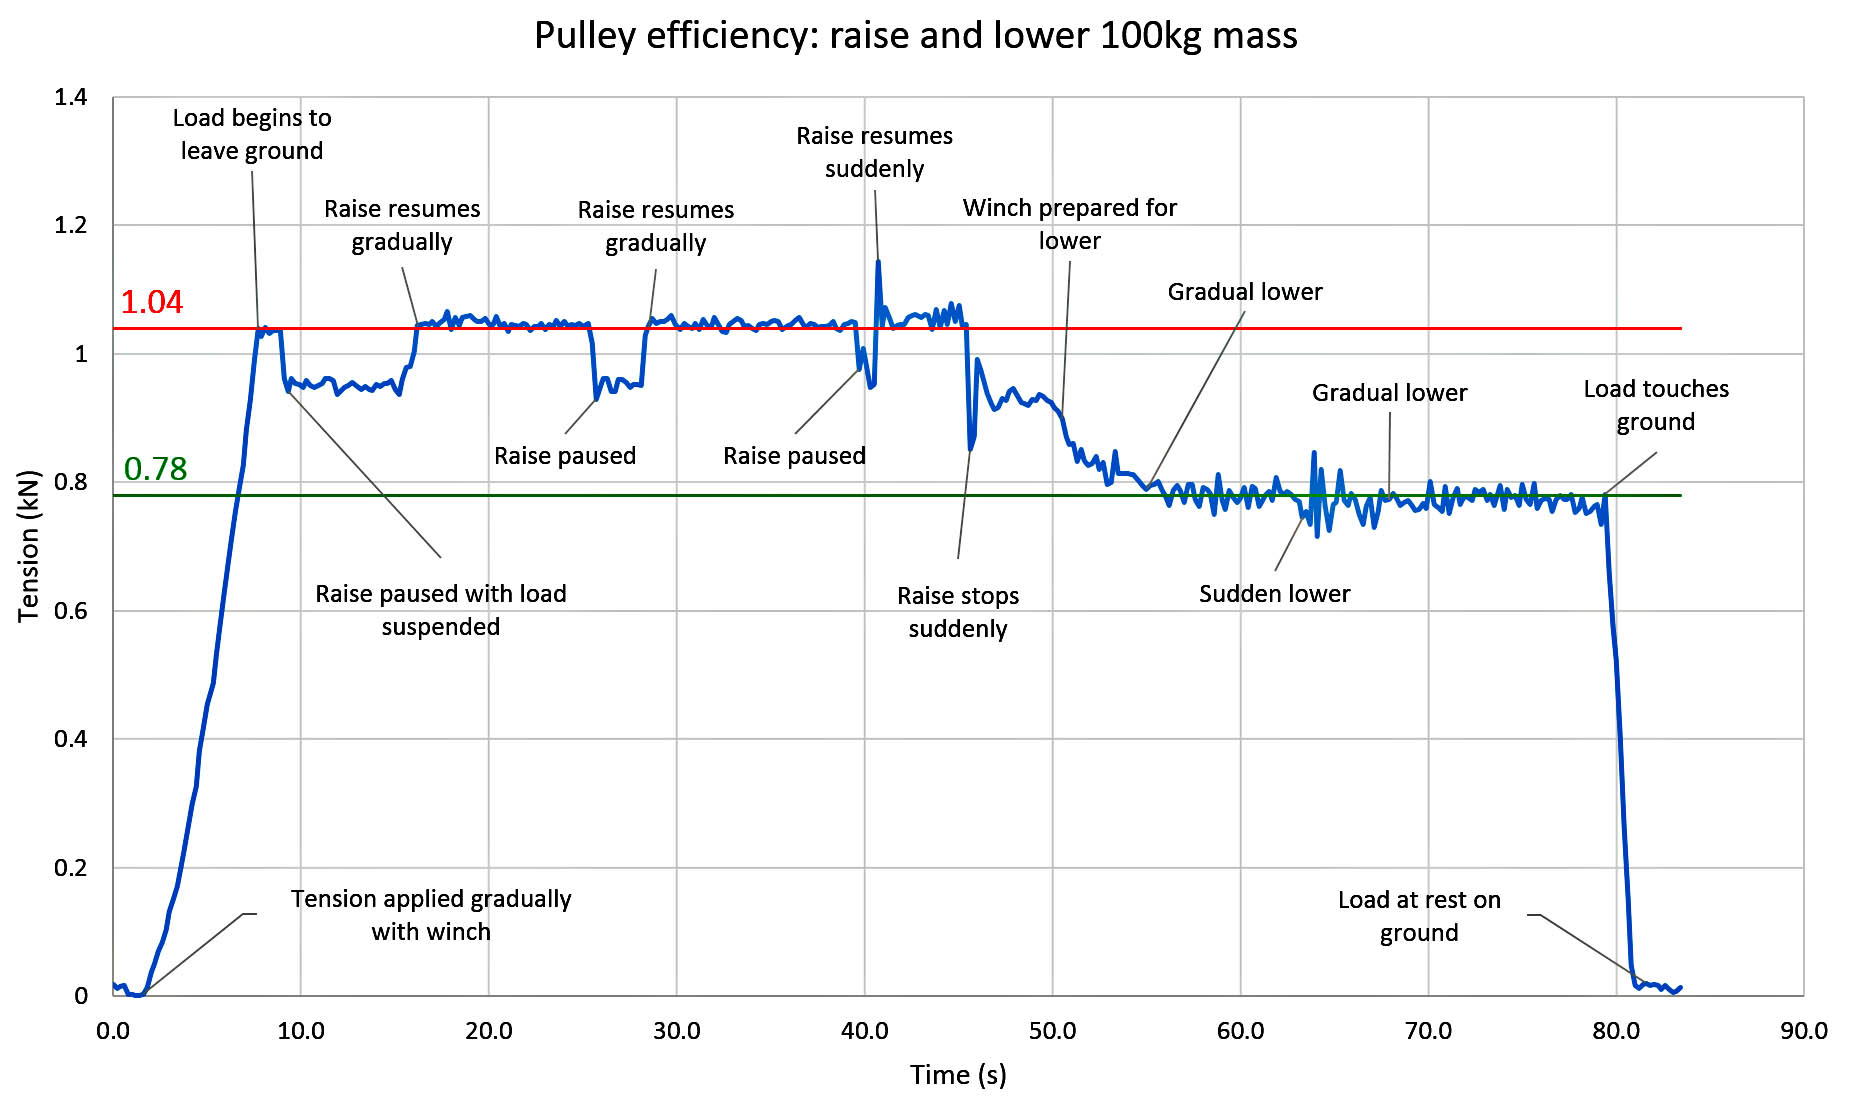
Once all of the tests were complete it was necessary to study each curve and determine a visual average of the typical tension during raise and lower. These estimates are shown in RED (1.04kN) and GREEN (0.78kN) above. The confidence in these values is +/-0.005kN.
Results
| Test | Brand | Model | Raise (kN) | Lower (kN) | Eff (%) | W (kN) |
| 15 | Rock Exotica | PMP 2.0 | 1.001 | 0.811 | 90 | 0.90 |
| 6 | SRT | P3 Purple BB | 1.022 | 0.803 | 89 | 0.91 |
| 24 | CMC | MPD | 1.022 | N/A | 88 | avg 0.90 |
| 1 | Rock Exotica | Omni 2.0 | 1.023 | 0.816 | 89 | 0.91 |
| 4 | Petzl | Rescue | 1.045 | 0.777 | 86 | 0.90 |
| 5 | Petzl | P50 | 1.060 | 0.780 | 86 | 0.91 |
| 19 | Petzl | Pro-traxion | 1.061 | 0.750 | 84 | 0.89 |
| 2 | Rock Exotica | Omni 1.5 | 1.077 | 0.782 | 85 | 0.92 |
| 9 | Riley | RM15A | 1.094 | 0.763 | 84 | 0.91 |
| 13 | DMM | Triple att – rapide | 1.101 | 0.742 | 82 | 0.90 |
| 14 | Rock Exotica | Mini single 1.1 | 1.132 | 0.732 | 80 | 0.91 |
| 17 | Petzl | Micro-traxion | 1.133 | 0.701 | 79 | 0.89 |
| 3 | Rock Exotica | Omni 1.1 | 1.136 | 0.739 | 81 | 0.92 |
| 7 | SRT | P3 Gold 2.0 | 1.136 | 0.727 | 80 | 0.91 |
| 11 | CMI | 2 3/8″ red/black | 1.146 | 0.710 | 79 | 0.90 |
| 10 | Chouinard | BD nylon | 1.148 | 0.710 | 79 | 0.90 |
| 8 | SRT | P2 Gold 1.5 | 1.177 | 0.706 | 77 | 0.91 |
| 12 | DMM | Pinto (bushed) | 1.297 | 0.630 | 70 | 0.90 |
| 18 | Petzl | Mini-trax | 1.346 | 0.588 | 66 | 0.89 |
| 16 | Petzl | Ultralegere | 1.361 | 0.580 | 65 | 0.89 |
| 23 | CT | Orbiter M | 1.364 | 0.593 | 66 | 0.90 |
| 20 | DMM | Revolver biner | 1.642 | 0.455 | 53 | 0.86 |
| 21 | DMM | 1 x UltraO biner | 1.949 | 0.348 | 42 | 0.82 |
| 22 | DMM | 2 x UltraO biner | 2.063 | 0.292 | 38 | 0.78 |
| 25 | Petzl | IDs | 2.764 | N/A | 33 | avg 0.90 |
These results have been ranked according to the tension required to raise the load.
As a final check, the theoretical weight of the load was calculated by multiplying the efficiency by the raise tension. While the carabiners have been included for interest, they are not true pulleys and capstan friction is significant. Averaging the derived weights for the true pulleys (ignoring the carabiners) yields 0.90kN. Note that this is not the same as the known test mass (100kg = 0.98kN) but this is not of concern given the mass of the test equipment and zero/reference point. The fact that they are all close in value gives confidence in the methodology.
Observations
The results of these tests are not surprising:
- Large sheave (50mm), ball-bearing pulleys are 85-90% efficient.
- Small sheave pulleys, ball-bearing pulleys are 80-85% efficient.
- Bushed pulleys are 65-80% efficient.
- Carabiners (used as non-spinning pulleys) are 35-45% efficient.
- Non spinning progress capture devices (ie Petzl IDs) are 30% efficient.
It should be pointed out that there are some limiting considerations to these observations:
- The test mass was 100kg. Significantly different masses will probably produce different results.
- The raise/lower distance was only 2m. Over longer distances heat generation (associated with inefficiency) may change performance.
- These measurements assume a complete 180 degree change in rope direction. The relationship between angle and efficiency has not been tested here.
Application
These tests confirm:
- Large sheave, ball-bearing pulleys are the most efficient.
- The weight saving of smaller sheave, ball-bearing pulleys is justified.
- Any non ball-bearing 180° change in rope direction should be considered 50% efficient.
- Non-pulley based systems of progress capture are less than 50% efficient.
© Richard Delaney, RopeLab 2015
Related Posts
About The Author
Richard Delaney
Richard Delaney has worked professionally with ropes since 1992 as a multi-pitch rock-climbing instructor, technical rescue instructor and rope access technician. Understanding and teaching the Physics of Rigging is a core passion of Richard’s, one based on his experience, and his prior professional life as a qualified engineer.
Add a Comment
You must be logged in to post a comment.
When I have done similar tests I have found that rope/cord type and diameter have make small but repeatable and measurable differences in efficiency. Note; I have not gone to the same effort to obtain results to Richard’s level of accuracy. As always a great job done here, thanks!
Hi Rich, great work as always! Do you have a copy of the plot graph for the Petzl ID? With a 230kg rescue load the required force to raise the loads are starting to get large to say the least!
Take care
Phil
Hi Phil,
Here’s the raw data from the raise of 90kg through the IDs:
Yes, with a 230kg rescue load through an IDs as a pulley you would have to apply almost 700kgf in tension to the tail rope. If the IDs is used as progress capture at the back of a 3:1 hauling system then things are a bit better as the forward ‘z’ component effectively operates as a 2:1 and then the rope bumps through the IDs.
Cool. Would be interesting to see the ISC D4 (which they claim is made for maximum efficiency in hauling systems as I read somewhere…) and the little Camp Druid Pro. Maybe you can include that in the future.
Thanks for your testing!
The bottom line is that capstan friction depends on the angle through which the rope changes direction within the device.
I have not looked at the angle change through the D4 or the Druid but they will not be that different to the I’D S.
I did some more testing comparing Capstan theory predictions with actual measurements when trying to raise a 1kN load.
For the I’DS, prediction was 2.5kN, measured was 2.65kN
For the GriGri2, prediction was 2.1kN, measured was 2.2kN.
Notice that the GriGri2 has approx. 180 degree change in direction, the I’D S has approx. 270 degrees and hence has more friction.